Environment

Environmental overview

Environmental overview

Minimising our environmental impact across the whole value chain is a core target for us. We’ve been setting annual improvement targets since 2004 and are working towards ambitious 2020 goals.

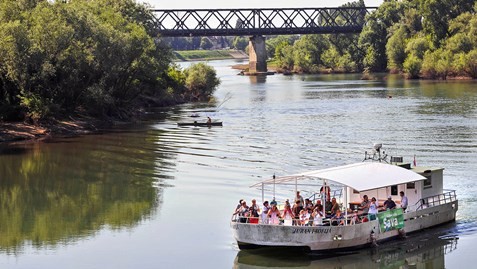
River Sava River Sava

Our aim is to continuously reduce the direct impacts of our operations on the environment, as well as the indirect impacts of our suppliers and partners.

Our approach to environmental protection is based on innovation and constantly finding new ways to achieve sustainability, as well as looking to reduce our negative impacts on the environment.

Bearing in mind the most significant impacts of our business on a global level, and in Croatia, we are focused on and want to be a global leader in the following areas:

  • Sustainable use of water and energy
  • Climate protection
  • Recycling
  • Packaging 

 We are fully compliant with applicable laws and regulations on environmental protection. In 2015, as in previous years, we did not receive any penalties on these grounds. In addition, no complaints were made directly to our business.

Environmental policies and standards

We aim to minimise the impacts of our business on the natural environment. In Croatia, we first achieved ISO14001 in 1996 and have maintained it ever since.  We also implement a series of internal procedures and policies, including:

  • Environmental policy
  • Climate change policy
  • Post-consumer packaging waste management policy
  • Water stewardship policy
  • Fleet safety policy 

Our approach involves making sure all our employees understand their responsibilities. Induction training for new starters at Coca‑Cola HBC Croatia includes an element about protecting the environment.

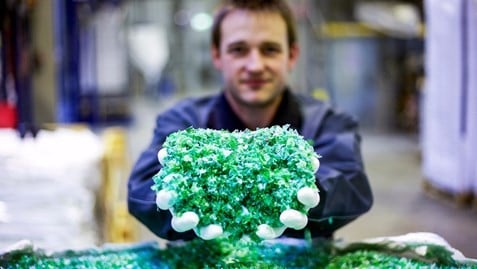
Man with plastic waste Man with plastic waste

Environmental performance

18.48%

Reduction in water consumption

Water consumption (L/L beverage produced)

  Zagreb
2007 1.95
2017 1.59
2007 vs 2017 -18.48%
-20.12%

Reduction in energy consumption

Energy consumption (MJ/L beverage produced)


Zagreb
2007 0.49
2017 0.39
2007 vs 2017 -20.12% 
98.61%

Of our solid waste is recycled in 2017

Generated waste (g/L beverage produced)


Zagreb
2007 33.84
2017 4.60
2007 vs 2017 86.41%

Recycled waste (%)


Zagreb
2007 90.31
2017 98.61
2007 vs 2017 9.19%

Recycled waste (%)


Zagreb
2007 90.31
2017 98.61
2007 vs 2017 9.19%
-29.02%

Reduction in CO2 emission


CO2 emission (g/L beverage produced)


Zagreb
2007 43.40
2017 30.80
2007 vs 2017 -29.02%

Downloads